Pod-Level Scheduling Metrics
Gthulhu provides pod-level scheduling metrics powered by eBPF, allowing you to observe low-level kernel scheduling behavior for each Pod in your cluster — without modifying application code.
Overview
The metrics collection pipeline works as follows:
graph LR
    A[Kernel tracepoints
sched_switch / sched_process_exit] -->|per-PID data| B[eBPF hash map
task_metrics]
    B -->|poll every N seconds| C[Go Collector
+ PodMapper]
    C -->|aggregate per-Pod| D[Prometheus /metrics]
    D --> E[Grafana Dashboard]
    C -->|query via API| F[Web GUI]
    C -->|EWMA + clustering| G[Adaptive Classification]
- eBPF tracepoints (
tp_btf/sched_switch,tp_btf/sched_process_exit) capture per-PID scheduling events in the kernel. - Go Collector periodically reads the BPF hash map and maps PIDs to Pods using
/proc/<pid>/cgroup. - Per-PID metrics are aggregated into per-Pod metrics and exposed via Prometheus and the REST API.
Available Metrics
| Metric | Description |
|---|---|
| Voluntary Context Switches | Times the task voluntarily yielded the CPU (e.g., I/O wait) |
| Involuntary Context Switches | Times the task was preempted by the scheduler |
| CPU Time (ns) | Total CPU execution time in nanoseconds |
| Wait Time (ns) | Time spent waiting in the run queue |
| Run Count | Number of times the task was scheduled to run |
| CPU Migrations | Number of times the task migrated between CPU cores |
Prometheus metric names use the gthulhu_pod_ prefix, for example:
gthulhu_pod_voluntary_ctx_switches_totalgthulhu_pod_involuntary_ctx_switches_totalgthulhu_pod_cpu_time_nanoseconds_totalgthulhu_pod_wait_time_nanoseconds_totalgthulhu_pod_run_count_totalgthulhu_pod_cpu_migrations_totalgthulhu_pod_process_count
All metrics carry labels: pod_name, pod_uid, namespace, node_name.
Configuring Metrics Collection
You can create metrics collection configurations using either the Web GUI or the PodSchedulingMetrics CRD.
Option A: Web GUI
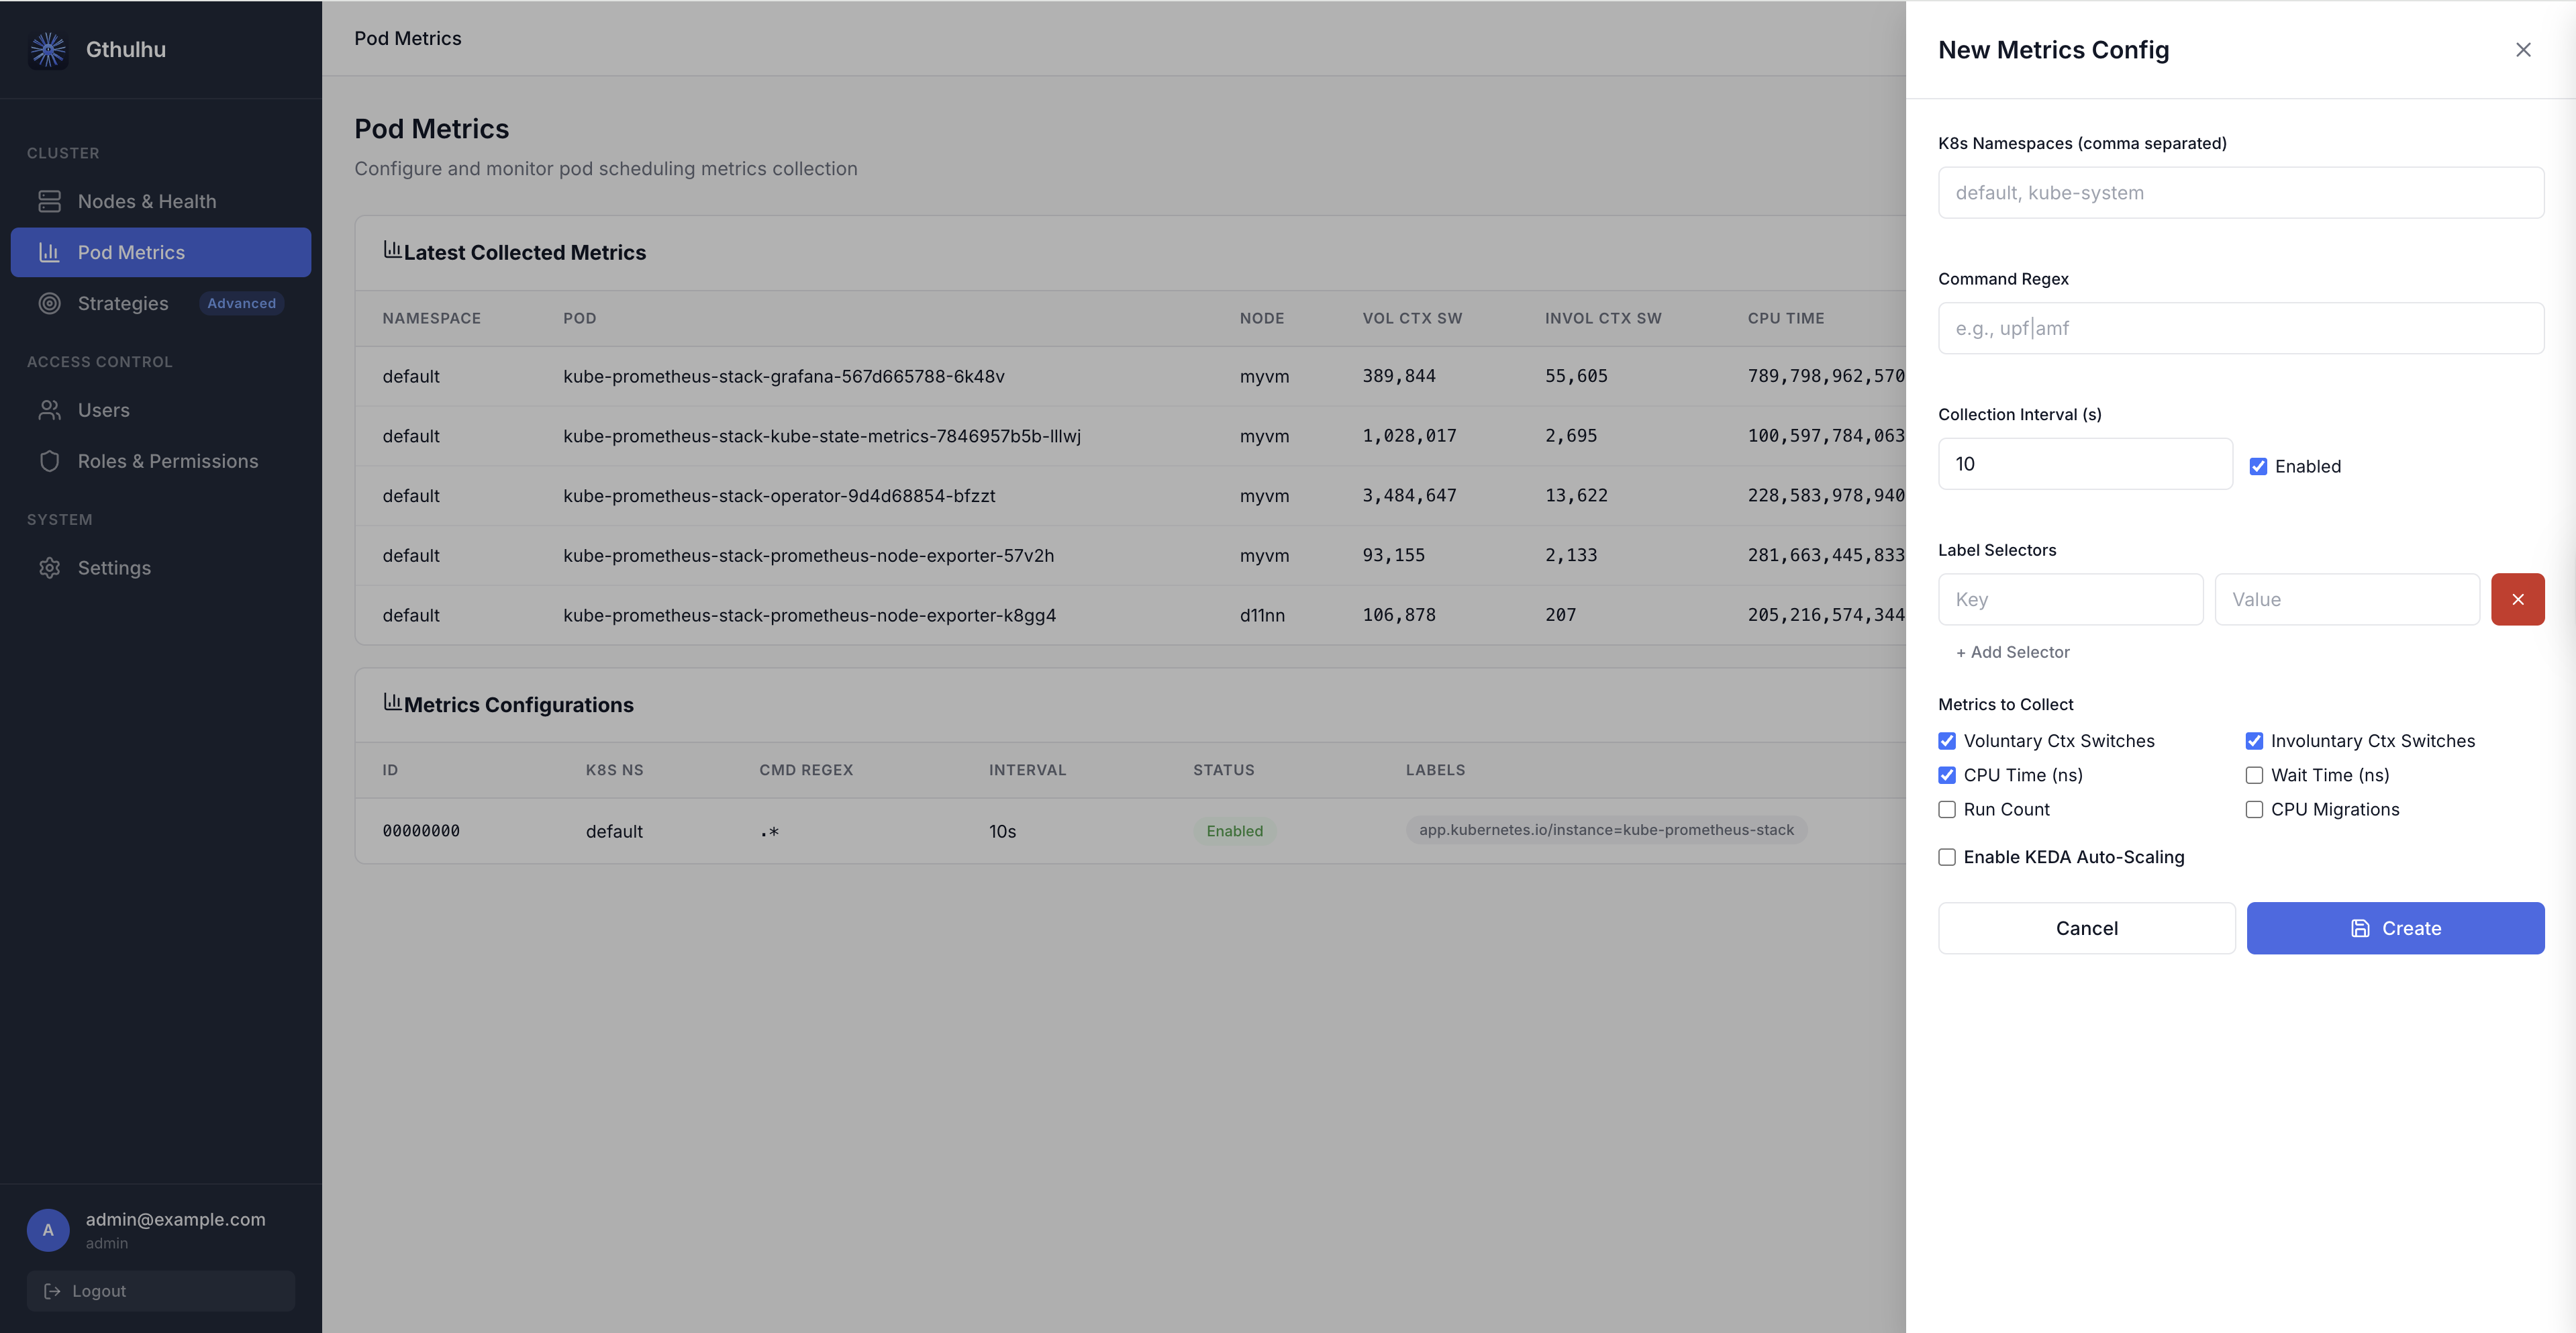
- Log in to the Gthulhu Web GUI (see Configuring the scheduling policies for access instructions).
- Navigate to Pod Metrics in the sidebar.
- Click New Config to open the configuration panel.
Fill in the following fields:
| Field | Description |
|---|---|
| Label Selectors | Key-value pairs to match target Pods (at least one required). For example, app=nginx. |
| K8s Namespaces | Comma-separated list of namespaces to scope the collection. Leave empty for all namespaces. |
| Command Regex | Regular expression to filter processes inside matched Pods. For example, nginx\|worker. |
| Collection Interval (s) | How often metrics are aggregated and exported (default: 10 seconds). |
| Enabled | Toggle to enable or disable this configuration. |
| Metrics to Collect | Checkboxes to select which metrics to collect. By default, Voluntary Ctx Switches, Involuntary Ctx Switches, and CPU Time are enabled. |
After saving, the configuration takes effect immediately — the eBPF collector on each node will begin tracking the matching Pods' processes.
Option B: PodSchedulingMetrics CRD
If you prefer declarative configuration, apply a PodSchedulingMetrics custom resource:
apiVersion: gthulhu.io/v1alpha1
kind: PodSchedulingMetrics
metadata:
  name: monitor-upf
  namespace: default
spec:
  labelSelectors:
    - key: app
      value: upf
  k8sNamespaces:
    - free5gc
  commandRegex: ".*"
  collectionIntervalSeconds: 10
  enabled: true
  metrics:
    voluntaryCtxSwitches: true
    involuntaryCtxSwitches: true
    cpuTimeNs: true
    waitTimeNs: false
    runCount: false
    cpuMigrations: false
Apply it with:
The CRD Watcher on each node detects the resource and dynamically updates the eBPF monitoring scope.
Viewing Runtime Metrics
Web GUI
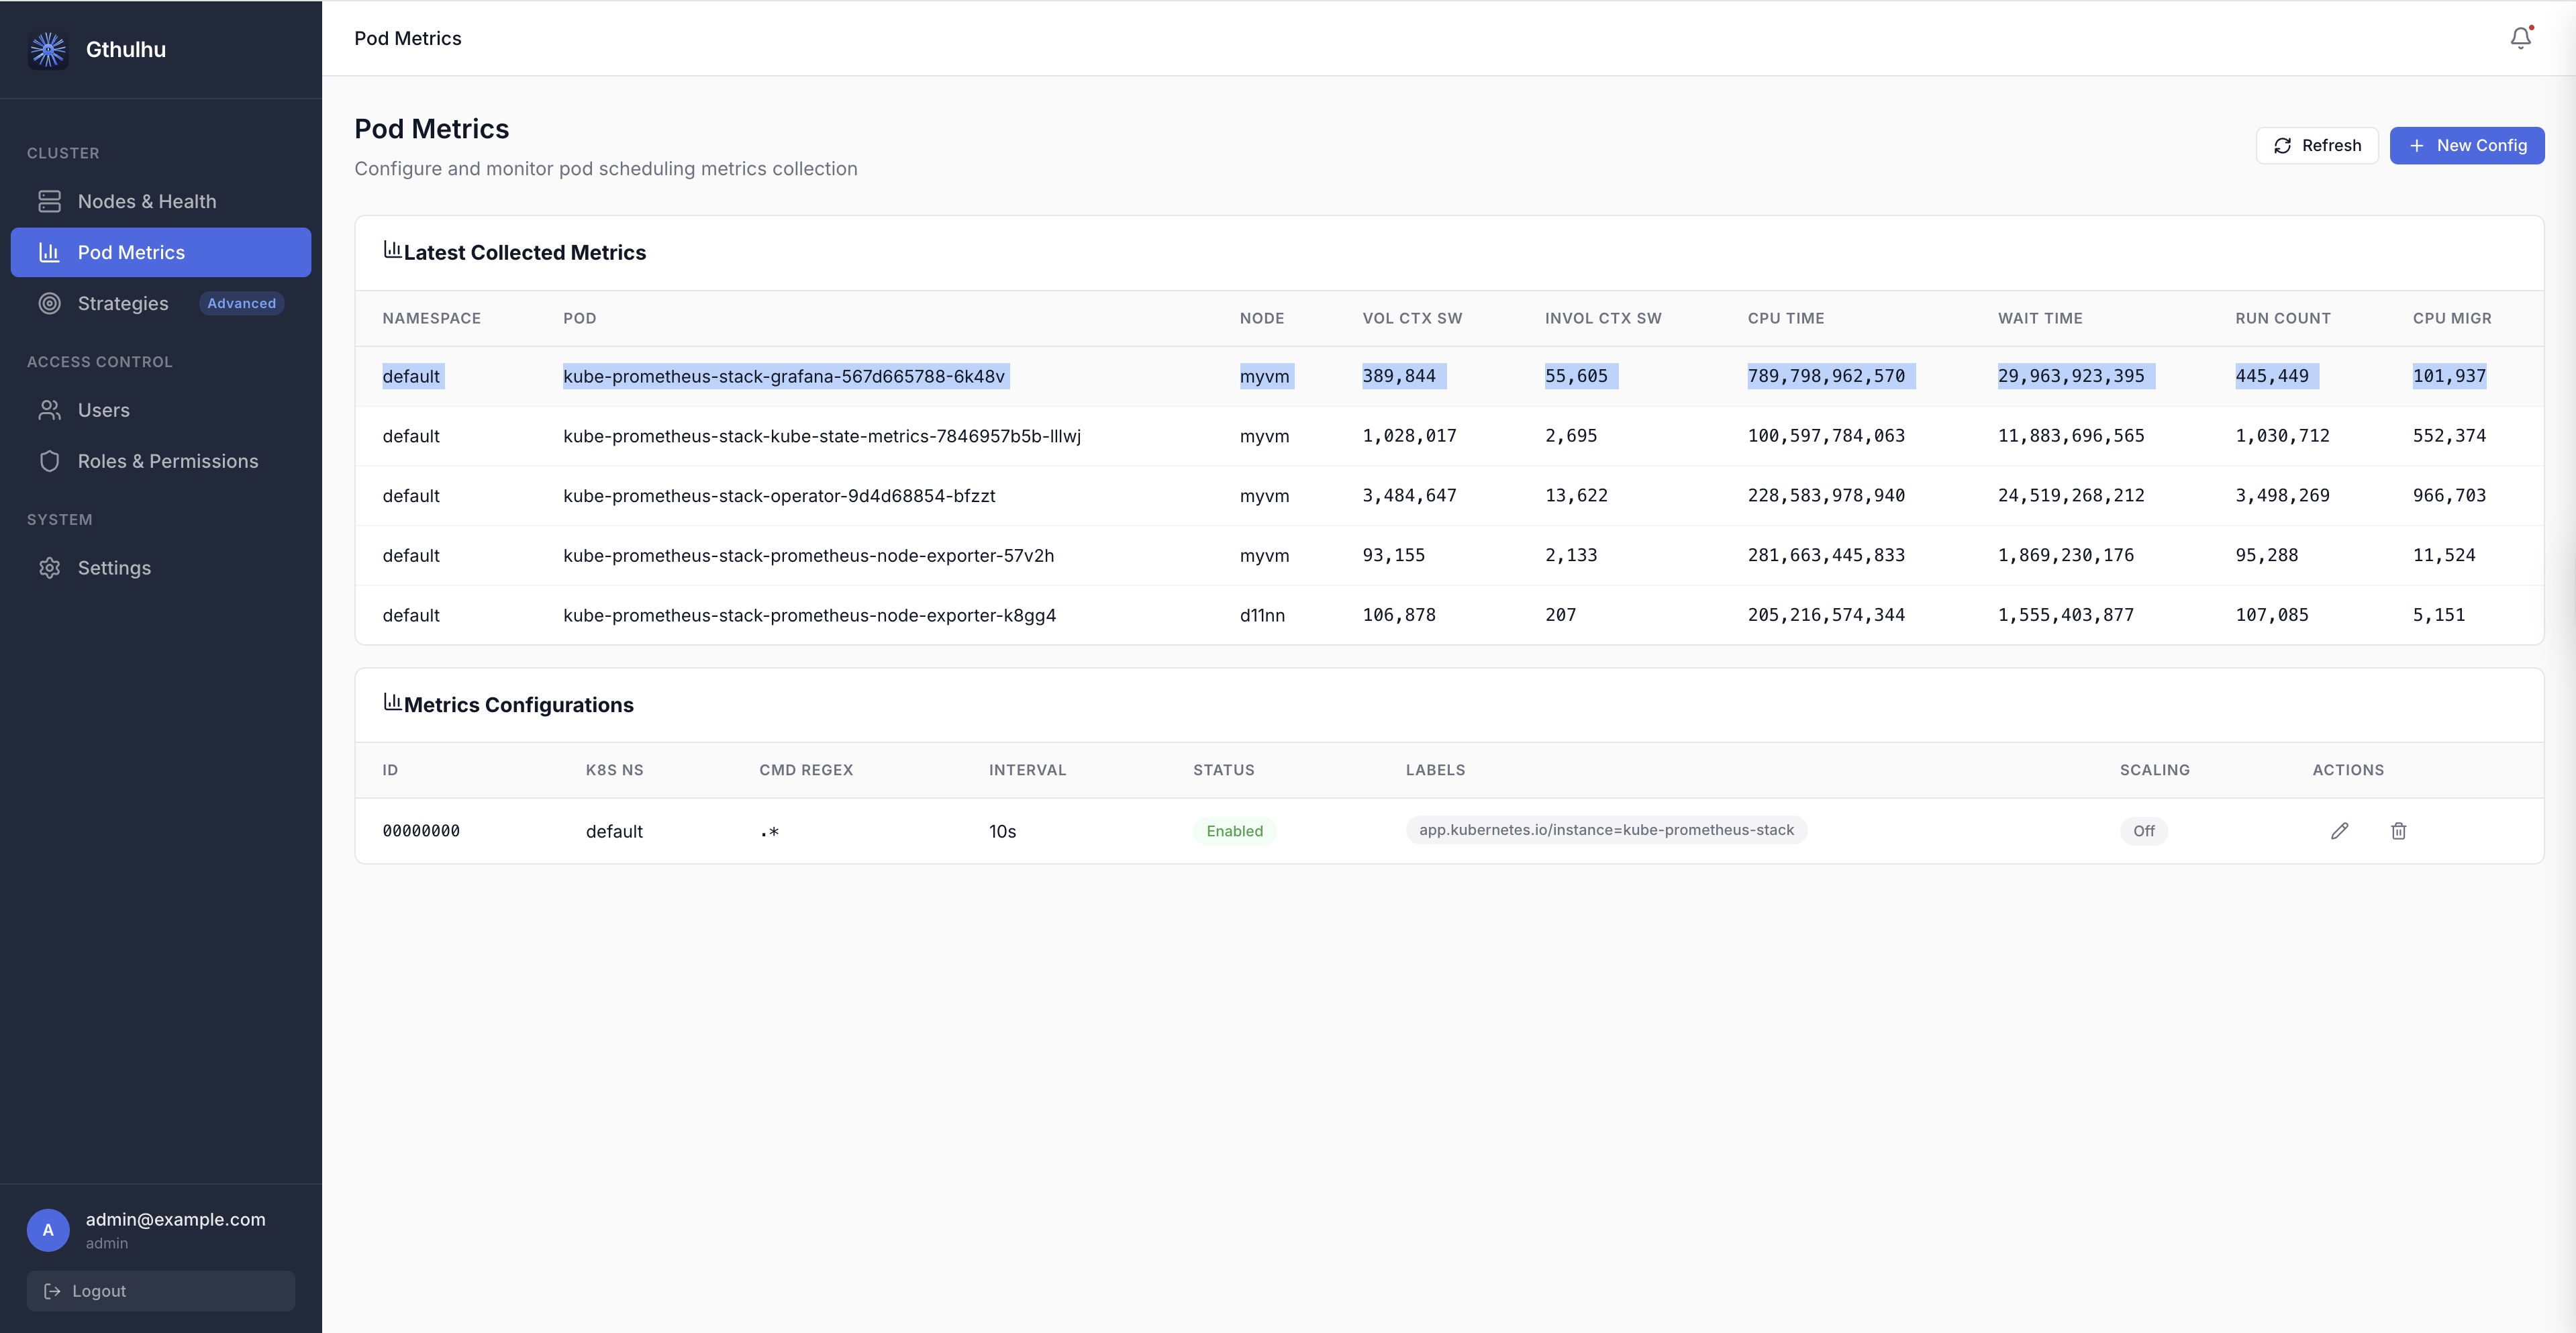
On the Pod Metrics page, the Latest Collected Metrics table displays real-time data:
| Column | Description |
|---|---|
| NAMESPACE | Pod namespace |
| POD | Pod name |
| NODE | Node where the Pod is running |
| VOL CTX SW | Voluntary context switches |
| INVOL CTX SW | Involuntary context switches |
| CPU TIME | CPU execution time (nanoseconds) |
| WAIT TIME | Run-queue wait time (nanoseconds) |
| RUN COUNT | Number of scheduling events |
| CPU MIGR | CPU migration count |
Click Refresh at any time to fetch the latest data.
REST API
You can also query runtime metrics programmatically:
# List all metrics configurations
curl -H "Authorization: Bearer $TOKEN" \
  http://localhost:8080/api/v1/pod-scheduling-metrics

# Get latest collected runtime metrics
curl -H "Authorization: Bearer $TOKEN" \
  http://localhost:8080/api/v1/pod-scheduling-metrics/runtime
The runtime endpoint returns a JSON response like:
{
  "success": true,
  "data": {
    "items": [
      {
        "namespace": "free5gc",
        "podName": "upf-pod-abc123",
        "nodeID": "worker-1",
        "voluntaryCtxSwitches": 15234,
        "involuntaryCtxSwitches": 892,
        "cpuTimeNs": 4820000000,
        "waitTimeNs": 120000000,
        "runCount": 16126,
        "cpuMigrations": 47
      }
    ],
    "warnings": []
  }
}
Prometheus & Grafana
The metrics are exported on the monitor's Prometheus endpoint (default port 9090). You can:
- Add the Gthulhu monitor as a Prometheus scrape target.
- Use Grafana to build dashboards visualizing scheduling behavior across Pods.
Example PromQL queries:
# Voluntary context switches rate per Pod
rate(gthulhu_pod_voluntary_ctx_switches_total[5m])

# CPU time per Pod in the last hour
increase(gthulhu_pod_cpu_time_nanoseconds_total[1h])

# Top 10 Pods by involuntary context switches
topk(10, rate(gthulhu_pod_involuntary_ctx_switches_total[5m]))
Adaptive Classification
Adaptive Classification automatically identifies workload patterns and potential scheduling bottlenecks from each Pod's short-term and long-term scheduling behavior. It builds EWMA (exponentially weighted moving average) profiles from collected pod-level metrics, then uses adaptive clustering to label Pods with inferred workload types. This helps you decide whether to adjust CPU resources, priority, or NUMA placement.
On the Pod Metrics page, the Adaptive Classification table can be filtered by:
| Filter | Description |
|---|---|
| namespace | Show only Pods in the specified Kubernetes namespace. |
| phase | Filter by classifier lifecycle phase, such as stable or drifting. |
| type | Filter by inferred workload type, such as cpu_heavy. |
The table columns are:
| Column | Description |
|---|---|
| NAMESPACE | Kubernetes namespace where the Pod runs. |
| POD | Pod name. |
| PHASE | Current lifecycle phase of the classifier. |
| CURRENT TYPE | Workload labels inferred by the model. A Pod may have multiple labels. |
| CONFIDENCE | How closely the Pod's short-term EWMA profile matches its assigned cluster center (0–100%). |
| DRIFT | Offset score between the short-term and long-term EWMA profiles, used to detect behavior changes. |
| ACTION | Scheduling adjustment recommendation generated from the classification result. |
| DETAIL | Opens a side panel with classification details for the Pod. |
Classifier Phases
| Phase | Description |
|---|---|
cold_start |
Insufficient samples (fewer than 10), so no stable classification is produced yet. |
warming_up |
Initial samples have been collected (about 10–30), and preliminary clustering is being built. |
stable |
The model has converged, and classification results can be used as the primary signal. |
drifting |
A workload behavior shift has been detected, and the system is observing whether it persists. |
transitioning |
Drift has been confirmed, and the model is re-clustering or updating the classification. |
Workload Types
| Type | Basis |
|---|---|
cpu_heavy |
High CPU time per scheduling run, likely a CPU-intensive workload. |
interactive |
High voluntary context switch ratio, common in interactive or I/O-wait-heavy workloads. |
needs_higher_priority |
High involuntary preemption, possibly caused by scheduling contention or insufficient priority. |
cache_unfriendly |
Frequent cross-L3 cache migrations, which may reduce cache locality. |
numa_unfriendly |
Frequent cross-NUMA-node migrations, which may increase memory access latency. |
scheduling_latency |
High wait time relative to run count, indicating more visible scheduling latency. |
balanced |
No dominant bottleneck signature; overall behavior is relatively balanced. |
Drift and Recommended Actions
The drift score is the average deviation between short-term and long-term EWMA profiles, normalized by long-term variance. A score above 1.5 enters the drifting state; if the high offset continues for 3 consecutive periods, the classifier confirms transitioning, meaning the workload type may have changed.
| Recommended Action | Description |
|---|---|
increase_cpu_limit |
The Pod may be CPU-limited or CPU-starved; check CPU requests and limits. |
pin_to_numa_node |
NUMA migration rate is high; evaluate NUMA binding or topology-aware placement. |
raise_priority |
Involuntary preemption pressure is high; check priority and resource contention. |
keep_current / no_action |
The Pod is stable or has no obvious bottleneck, so the current configuration can be kept. |
Prerequisites
| Component | Requirement |
|---|---|
| Linux Kernel | 5.2+ with BTF enabled (no sched_ext required for metrics-only mode) |
| Gthulhu Monitor | Deployed as a DaemonSet on each node |
| Prometheus | For metric storage and querying |
| Grafana | (Optional) For visualization |